
In today’s time, the world is moving more toward a data-driven approach as it affirms efficient decision-making which is crucial for business growth. To achieve this, various tools are available in the market and Power BI stands out as a leader. Nowadays, it is one of the most in-demand courses in the field of data analysis and business intelligence. Power BI is a tool created by Microsoft for analysing business-related data. Microsoft’s sole purpose in designing this tool is to transform complex data into clear and interactive insights.
In this article, we will discuss about 20 Power BI interview Questions and answers that will help you to crack an interview and achieve your dream job.
What is Power BI?
Power BI is a business intelligence platform created by Microsoft that provides tools for non-technical users to collect, visualize, analyze, and share data effectively. In Power BI, you can import files from various sources and create interactive dashboards and BI reports to effectively visualize and analyze your data.
Difference between Power BI and Tableau?

| Power BI | Tableau |
| It is Business Analytics Tool | It is Powerful data Visualisation Tool |
| It can Limited access to other Server and Data base Example – SQL Database , SQL Server ,SAP, HANA Databse and so on. | It can Access to Multiple no of Data base source and Server Example – Text file , JSON File , PDF File, Microsoft SQL and so on. |
| It offers Query Editor and it is more flexible. | Does not offer Query Editor. |
| It is used for Interactive Data Visualisation and Bi | It is used to simplify Raw Data into Table format |
| It is use DAX For Calculating Measures | It is use MDX for measures and dimension |
| It can handle Limited amount of data | It can handle Large amount of data with Better Performance |
| It is use for Dashboards , Custom Visuals | It is used for longer run operation , Basis analysis |
Why should we use Power BI?
Power BI makes it effortless for anyone, including non-technical users, to connect to, transform, and visualize raw business data from various sources. It turns this data into worthwhile insights, enabling smarter business decisions.
Difference between Power Query and Power Pivot?
| Power Query | Power Pivot |
| Automating the task of getting and cleaning Data | It is all about analysis Data using Pivot Data Tool. |
| It Load Data to Power Pivot or Excel | it works with Data across Multiple Tables. |
What are the Benefits of Power BI?

- It Is User-Friendly.
- It Is Comparatively Less Expensive.
- It Connects With Lots Of Data Sources.
- It Is Compatible With All Types Of Organizations, Such As Small, Medium, And Large.
- It Is Compatible With All Types Of Devices, Including Laptops, Smartphones, And Any Other Machines.
What is Power BI Desktop?
Power BI Desktop is a Powerful tool from Microsoft Designed for Data analysis and reporting. It allows users to create interactive reports and dashboards by connecting to various data sources, transforming and cleaning data, designing reports with a wide range of visualisations, and building complex data models. For those preparing for a Power BI job, it’s important to be ready for common Power BI interview questions, which cover these aspects broadly.
What is Power Pivot?
Power pivot is a data modelling and analysis tool that enables users to import and combine data from multiple sources, define calculations using DAX (Data Analysis Expressions) Languages.
What is Power Query?
Power Query is an add-in for Microsoft Excel, introduced in the 2016 and 2019 versions. It is an ETL (Extract, Transform, Load) tool used for data cleaning. Power Query allows users to extract data from various sources, transform it within the tool, and then load it back into Excel. This method simplifies data preparation and makes it more comfortable to work with and analyze data in Power BI and Excel.
What are the Component of Power BI?
- Power Query
- Power Pivot
- Power View
- Power Map
- Power BI Service
- Data Management Gateway
- Data Catalog
Describe the components of Microsoft’s self-service BI solution?
Self-service business intelligence (SSBI) is divided into the Excel BI Toolkit and Power BI ,Power Automate (formerly Microsoft Flow), Power Apps ,Azure Synapse Analytics.
What is self-service BI, anyway?
Self-service business intelligence (SSBI) is divided into the Excel BI Toolkit and Power BI ,Power Automate (formerly Microsoft Flow), Power Apps ,Azure Synapse Analytics.
What is DAX?
DAX Stand for Data Analysis Expression. It is the collection of functions , operation and constant to perform advance calculation and queries on our data. With the help of DAX we can create calculated columns , Measures and Calculated Tables.
What are Filters in Power BI?

Filters in Power BI are important tools for developers to refine specific visuals and manage entire workbooks before transferring them with end users.
These filters are mathematical and logical conditions used to data, allowing developers to separate and focus on important information within rows and columns. By utilizing different types of filters, developers can confirm that the data presented is appropriate and tailored to the needs of the report. Top web developers and web design firms also use these techniques to refine data presentation and enhance the quality of their reports.
What are Custom Visuals in Power BI?
Custom visuals in Power BI let you create, import, or use third-party visualizations to enhance how you show your data. These visuals go beyond the built-in options, allowing you to display your data in more appropriate and engaging ways for your audience.
What is GetData in Power BI?
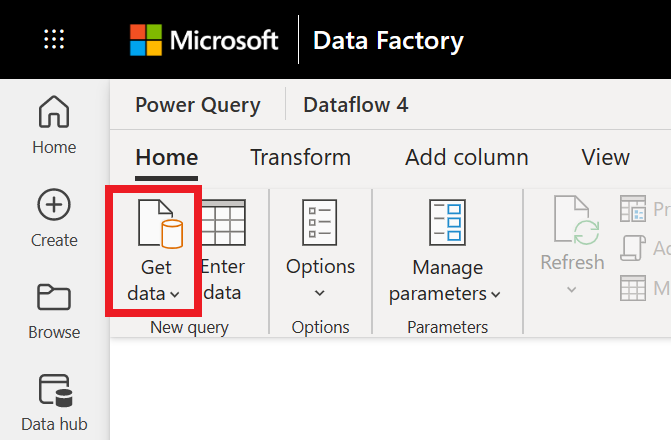
The “Get Data” icon in Power BI is use to import data from various sources. It supports over 100 different types of data sources, including common ones like text files, O Data, Notepad, SQL Server, and CSV files.
List out some drawbacks/limitations of using Power BI?
- Users with same emails domain is only allow to shared dashboards and reports
- Real Time Data can not be accessed by using power BI
- Power BI accepts files with a maximum size of 1 GB
- Dashboards in Power BI do not accept or pass user, account, or entry information based on any other parameters.
- Data refresh rates in Power BI services are limited
- Performance Issues with Large Datasets resulting in slow down data processing time and report rendering.
- Limited Data Handling in the Free Version
- Complexity of Learning the Tool epecially for the users who doesnot have digital analysis and business intelligenece background.
- A crowded user interface can be challenging for users, especially those unfamiliar with the tool, making it difficult to find and utilize the functionalities they need.
What are some differences in data modeling between Power BI Desktop and Power Pivot for Excel?
| Power Pivot for Excel | Power BI Desktop |
| It Supports single-directional relationships (one-to-many) where filters works only in one direction. | It Supports single-directional and bi-directional relationships , where filters is more flexible and works oin both directions. |
| Lacks built-in row-level security features. | Power BI Desktop Supports row-level security |
| It uses a single import mode. | Power BI Desktop Supports multiple import options including import mode , Direct Query Mode ,Dual Mode. |
What is a dashboard in Power BI?
Where They Are Create: Dashboards are made in the Power BI Service (online).
What They Show: They give a quick daily view of important numbers and performance indicators (KPIs).
How They Help
- Navigation: They have links or buttons that let you jump to detailed reports for more information.
- Interactive Elements: You can click on things to explore data in more depth.
Explain how relationships are defined in Power BI Desktop?
There are two main relationship can be define as:
Auto Detect Relationship – Power BI can Automatically detech and create relationship between tables if its find coloumn with the same name and data
Manual Relationship– If the column have the same name and data , then we need to create relationship manually as it unable to detech and create relationship between tables.
What is the CALCULATE function in DAX?
CALCULATE function in DAX is a powerful Function that allow users to moidfy the context in which other function are evaluates. It is use to create more complex calculation that depend on multiple filters ,data sets etc.
The calcuate function take one or more expression as input and applies on or more filter expression to modify the context in which expression are evaluates.
Explain the different types of filters in Power BI?
There are three types of Filters in Power BI.
Visual Filter – Apply filter on a specific visualization on a page.
Page level Filter -Apply Filter on all the visualization of a page.
Report level Filter -Applied across all pages of a report.
At Digitrendmarketing, we offer solutions to those who would like to sell their products and services online. Our expert technical maintenance team assists with front-end, back-end, and any technical issues to provide smooth daily operations.

Related Posts

What are the 4 types of Email marketing?

Building Tomorrow’s Web Today: Trust DigiTrend Marketing for Web Development Excellence